 Himal Press
 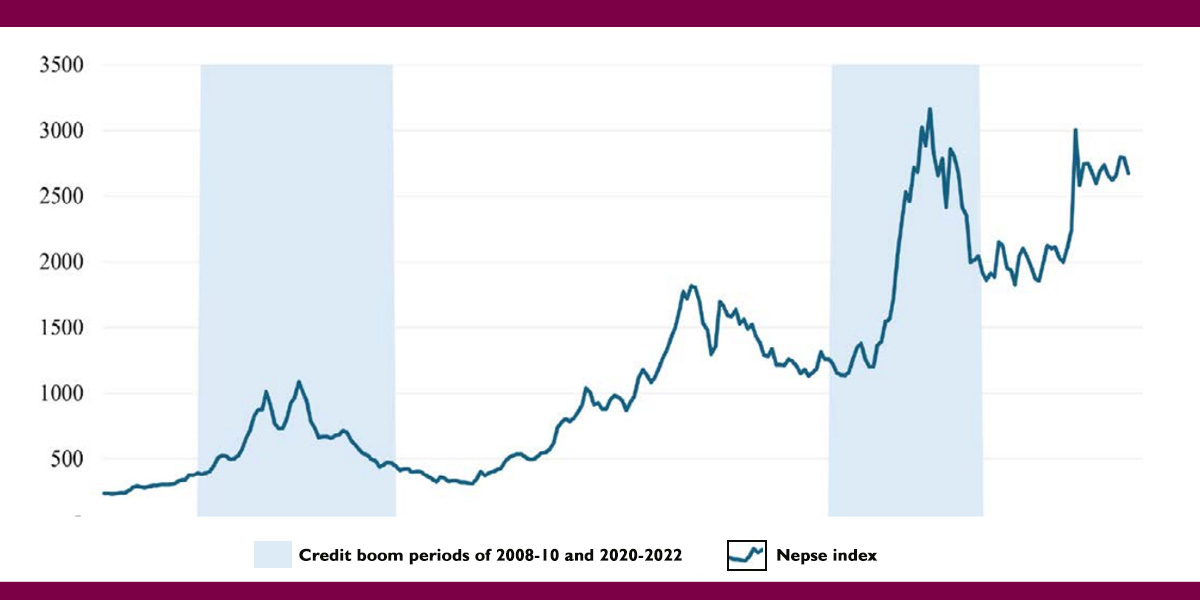 This graphic shows the movement of Nepse index during the credit boom periods of 2008-10 and 2020-22. (Source: NRB study)
KATHMANDU: A recent study by Nepal Rastra Bank (NRB) has found that the country’s stock market boom-bust cycles closely mirror periods of rapid credit expansion.
It added that such credit booms often culminate in external sector stress for the country.
A working paper titled ‘An Anatomy of Nepal’s Credit Boom1990-2025’, prepared by the central bank’s acting director Birendra Bahadur Budha, identified three credit boom periods in post-1990 Nepal.
Using monthly data of the Nepal Stock Exchange (Nepse) index from 2002 to 2025, the study identified a consistent pattern: equity prices surge during credit expansion phases and fall sharply as credit conditions tighten.
According to the study, the Nepse index rose from 379.24 in August 2006 to a peak of 1086.14 in August 2008—nearly tripling within two years. However, the rally proved unsustainable. The index fell by more than 50% from its peak within 15 months and returned to pre-boom levels within 31 months.
A similar pattern emerged during the most recent credit boom (2020-2022). The benchmark index climbed from 1224.04 in August 2019 to an all-time high of 3160.09 in August 2021, before dropping to 2041.06 by August 2022.
“This shows the clear pattern of rising stock prices during the credit expansion, and declining prices during the downswing of the credit boom,” the working paper added.
The study also found that credit boom periods in Nepal have consistently been accompanied by deteriorating external sector indicators, including widening current account deficits, balance of payments pressures and declining foreign exchange reserves.
According to the study, the current account deficit widened dramatically from 0.9% of GDP to 12.5% during the 2020–2022 credit boom. Over the same period, foreign exchange reserve adequacy dropped from 12.7 months of imports to 7.3 months. Similar trends were observed in earlier cycles, including the 1994–1996 and 2008–2010 periods.