According to statistics released on Sunday by the Nepal Tourism Board (NTB), Nepal welcomed 1,055,533 foreign tourists in the first 11 months of 2024.
A total of 114,501 tourists visited Nepal in November—a 5.40% increase compared to November last year, when 108,630 foreign visitors arrived. However, this figure remains below the record high of 130,303 visitors in November 2019.
March recorded the highest number of tourist arrivals in 2024, with 128,167 visitors, while July saw the lowest, at 64,599, according to the latest data from the Nepal Tourism Board (NTB). November brought in 114,501 tourists, closely following October, which registered 124,393 arrivals. April also saw strong numbers with 111,076 visitors, followed by February (97,426), September (96,305), May (90,211), January (79,100), June (76,736) and August (72,719).
Tourist arrivals in Nepal reached an all-time high of 1,197,191 in 2019. However, numbers declined in subsequent years due to the impact of COVID-19.
Arrivals dropped 80.7% to 230,085 in 2020 and further declined by 34.3% to 150,962 in 2021. The numbers rebounded in 2022, rising by 307.3% to 614,869, and continued to improve in 2023 with 1,014,885 visitors.
Officials were optimistic about reaching pre-COVID numbers this year, but the total arrivals over the first 11 months indicate that this goal will not be achieved.
| Year |
Arrivals |
Change |
| 1993 |
293,567 |
-12.20% |
| 1994 |
326,531 |
11.20% |
| 1995 |
363,395 |
11.30% |
| 1996 |
393,613 |
8.30% |
| 1997 |
421,857 |
7.20% |
| 1998 |
463,684 |
9.90% |
| 1999 |
491,504 |
6.00% |
| 2000 |
463,646 |
-5.70% |
| 2001 |
361,237 |
-22.10% |
| 2002 |
275,468 |
-23.70% |
| 2003 |
338,132 |
22.70% |
| 2004 |
385,297 |
13.90% |
| 2005 |
375,398 |
-2.60% |
| 2006 |
383,926 |
2.30% |
| 2007 |
526,705 |
37.30% |
| 2008 |
500,277 |
-5.00% |
| 2009 |
509,956 |
1.90% |
| 2010 |
602,867 |
18.20% |
| 2011 |
736,215 |
22.10% |
| 2012 |
803,092 |
9.10% |
| 2013 |
797,616 |
-0.70% |
| 2014 |
790,118 |
-0.90% |
| 2015 |
538,970 |
-31% |
| 2016 |
753,002 |
40% |
| 2017 |
940,218 |
24.80% |
| 2018 |
1,173,072 |
24.80% |
| 2019 |
1,197,191 |
2.10% |
| 2020 |
230,085 |
-80.70% |
| 2021 |
150,962 |
-34.30% |
| 2022 |
614,869 |
307.30% |
| 2023 |
1,014,885 |
65.10% |
| 2024 |
1,055,533* |
*Till November |
Source: Nepal Tourism Board
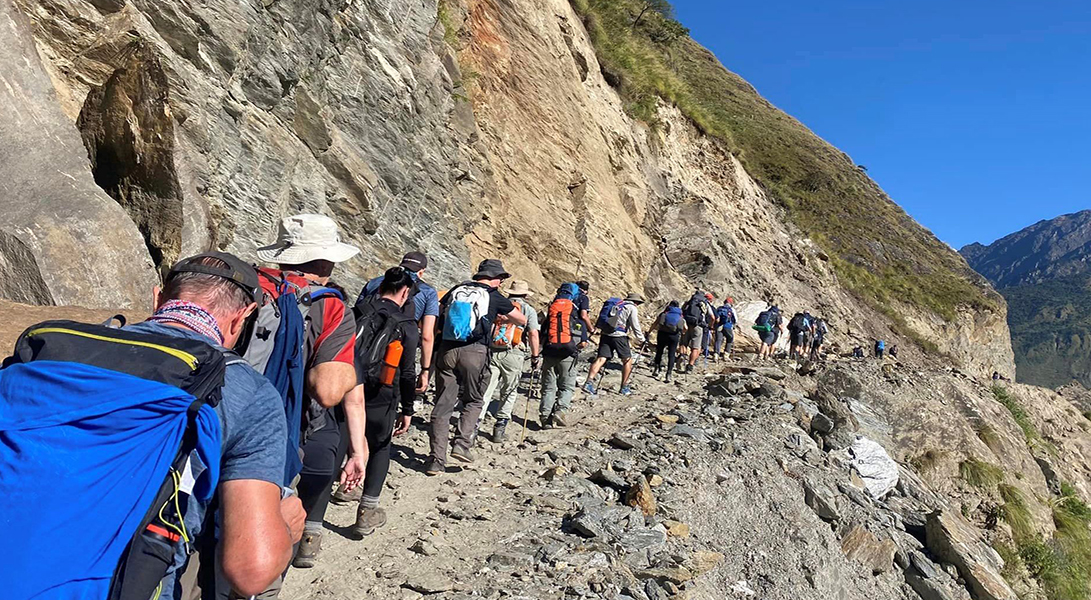 Trekkers on the Manaslu Circuit Trail (File Photo)

 Himal Press